Why 2017 was a tipping point for Twitter
Twitter analytics
After years of predictable behavior, Twitter analytics reveal that something strange is going on with how Twitter is used.
Something is happening to Twitter, but you don’t know what it is. Do you, Mr. Jones?
I started tweeting 16 years ago. Though I didn’t know it at the time, Twitter would turn out to be the most important way for people to discover my work and for me to connect with thousands of kindred souls all over the world who share my specialized interests. Over time, Conferences That Work grew into a website with ten million page views per year.
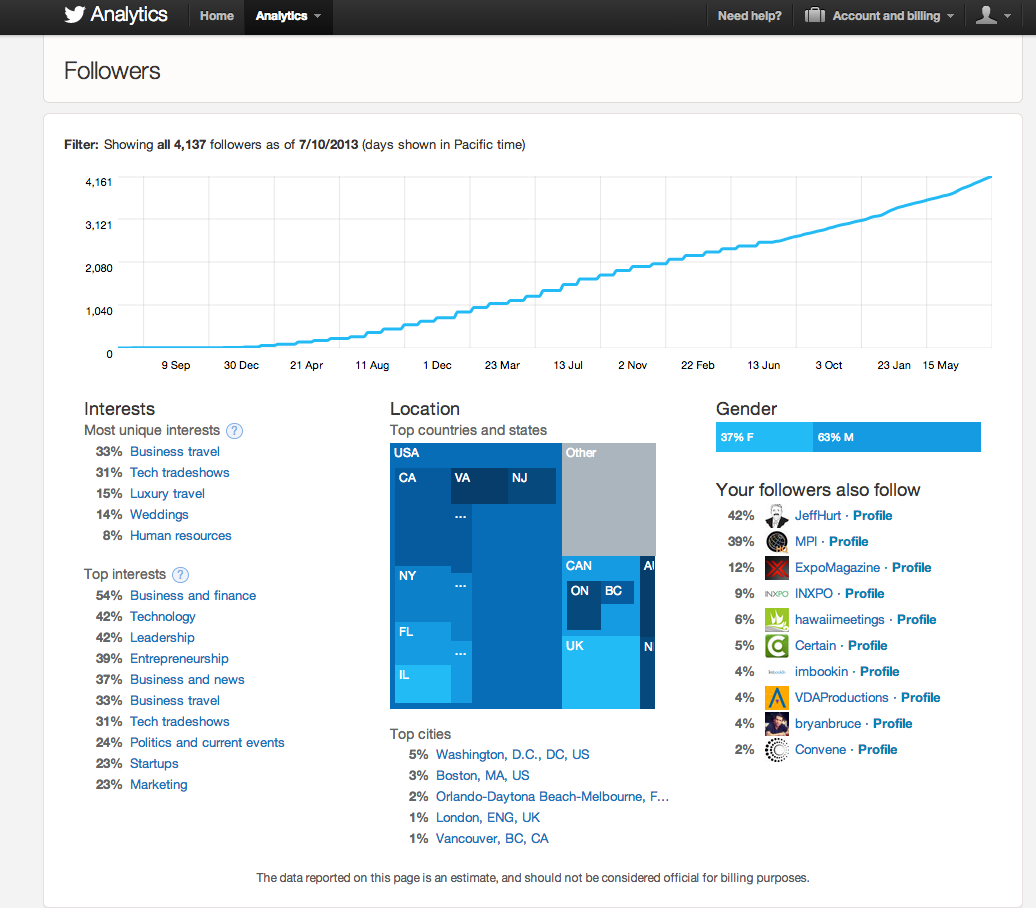
But as 2016 drew to a close I noticed that something was changing in the Twitter world. Here’s a graph of my follower count over time:

What I’ve noticed about my Twitter analytics over the last nine months
Since I began posting in June 2009, the graph shows that I consistently added between two to three followers per day — until around September 2017. At that point, highlighted by the red circle, there was an unusual increase to ~six followers/day for the remainder of 2016, followed by a sudden flattening that has persisted through the first half of 2017 to less than one follower/day.
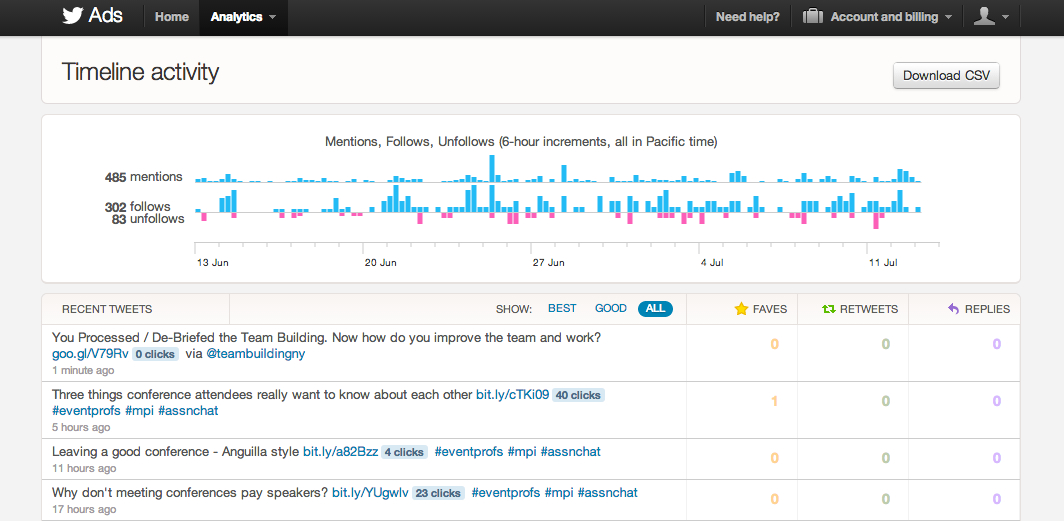
In 2017 I’ve also noticed a dramatic reduction in the number of retweets I’ve been receiving. Though I haven’t had time to develop quantitative statistics, it looks to me as though in 2017 retweets have been replaced to a large extent with likes, (though the frequency of mentions seems more or less unchanged).
Why are these changes happening?
I’ll begin with a caution that everything that follows is ultimately speculative. I can’t say definitively what is going on, and can think of multiple plausible reasons for these significant changes. For example:
- My experience may not be representative of other Twitter users. A sudden surge of engagement with my posts during Q4 2016, was followed by a rapid loss of interest.
- The US election results caused more people to visit Twitter for a few months, but attention eventually shifted to the continuous torrent of breaking news at the expense of general engagement.
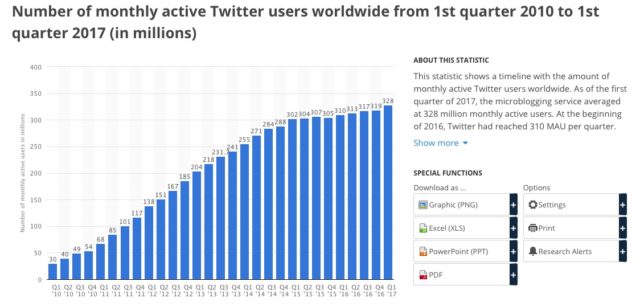
- Twitter user growth has been flattening for some time as per the graph below; my 2016 EOY bump is reflected in the graph’s Q1 2017 bump, but future official statistics will show little continued active growth.

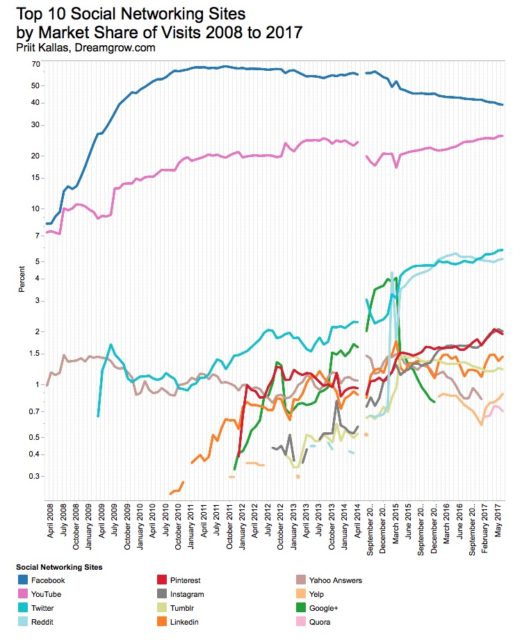
Taken from statista.com on July 14, 2017; click on graphic to see current stats - In retrospect, 2016-2107 will be seen as a period when late adopters continued to join Twitter, but a critical mass of active users concluded that engagement on the platform was not for them and moved to other social media platforms (I’m thinking Instagram for one). Although Twitter seems to be doing well in percentage market share of social networking site visits, as per the statistics below, it’s becoming more a site that users visit for breaking news — engagement is moving to other platforms.

Taken from dreamgrow.com on July 14, 2017; click on graphic to see current stats
What do I think is actually going on?
I’d put my money mainly on #4 above. Perhaps this Twitter analytics trend has been accelerated by #2’s associated flood of U.S. breaking news (61% of my followers are in the United States). It will be interesting to see if the trend continues, which may help to shine more light on what, to me, are changes that are interesting and important for anyone who uses Twitter for connection, content marketing, and engagement.
What do you think is going on? Add your ideas in the comments below!
P.S. My friend Heidi Thorne has just posted her thoughts on the changing Twitter landscape. Well worth a read from a different perspective!